Facets
Many of Gurita’s plots support facets.
Facets consist of multiple sub-plots aligned in columns and/or rows with uniform axes, each showing a subset of the data.
The subsets of data shown in the sub-plots are split according to the values of categorical columns.
For example, the following box plot uses facets to split into two sub-plots based on the value of
the sex column using the --fcol argument:
gurita box -y age -x class --fcol sex < titanic.csv
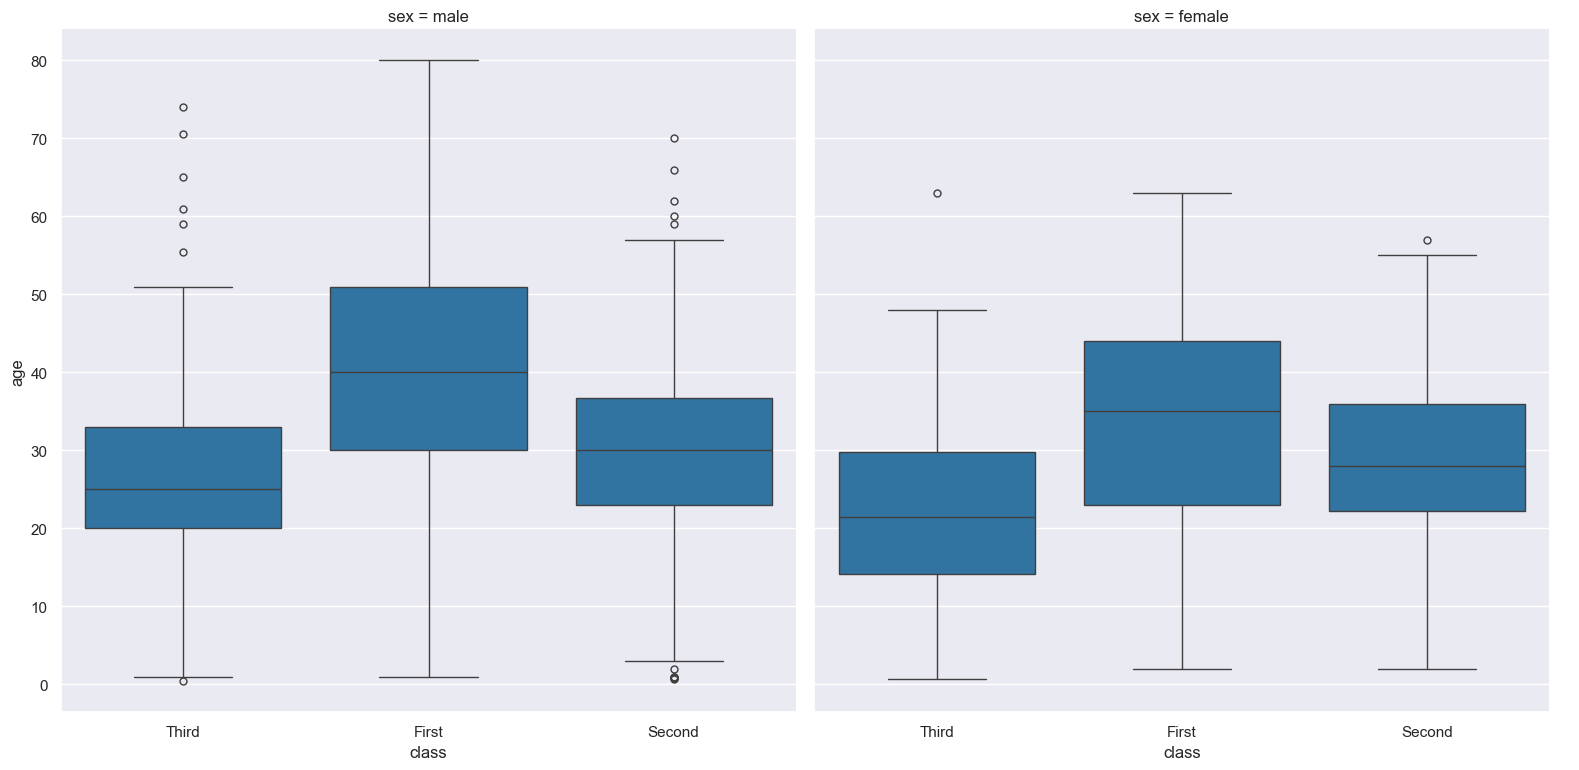
The output of the above command is saved into a file called box.class.age.sex.png.
In the above example the --fcol sex argument causes a colum-wise facet plot to be generated. Subsets of the data are defined based on the values in the sex column, which can be either male or female.
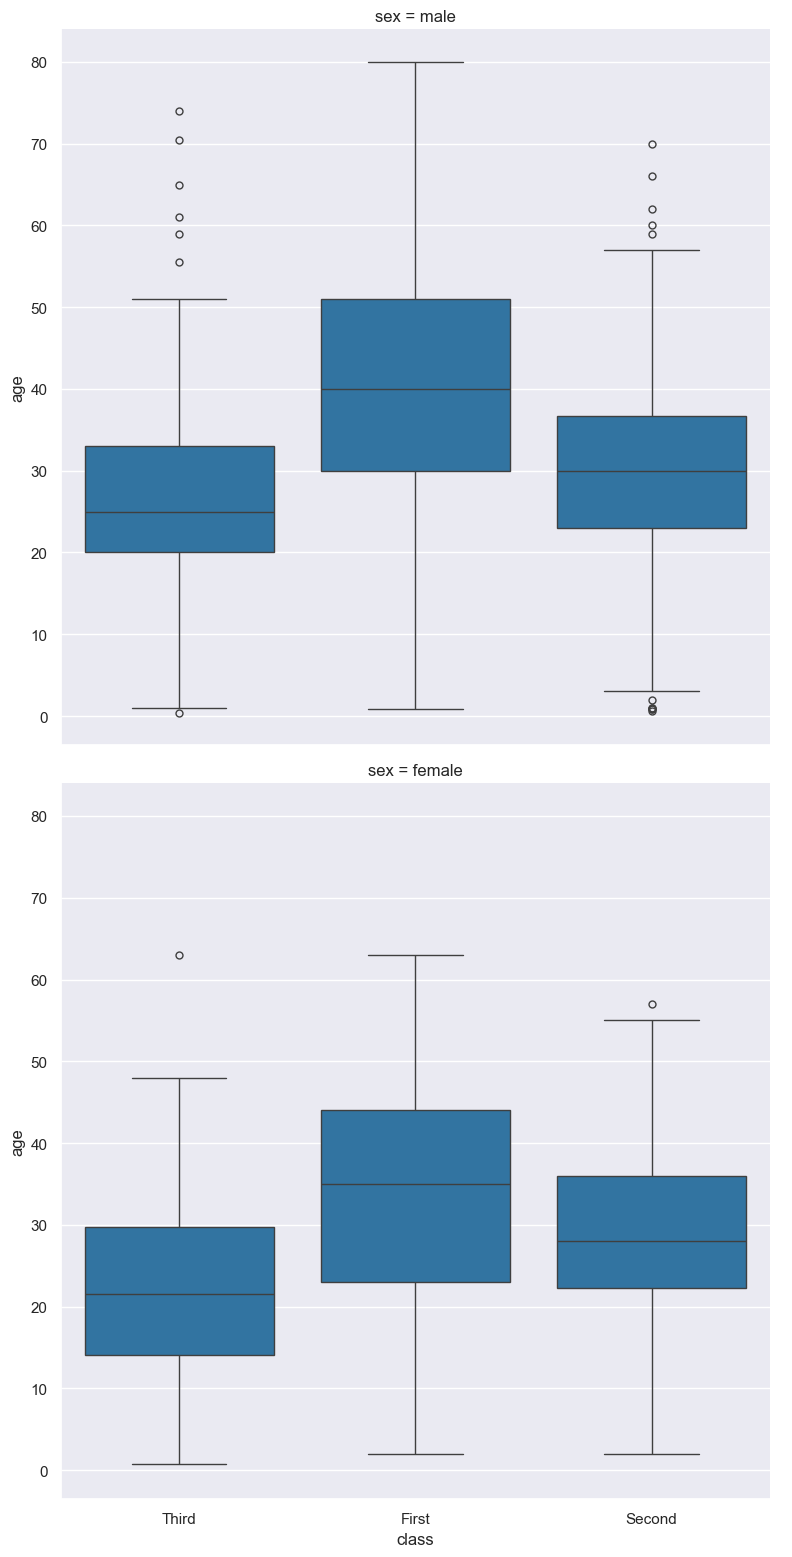
It is also possible to generate the facets row-wise, using --frow sex instead:
gurita box -y age -x class --frow sex < titanic.csv
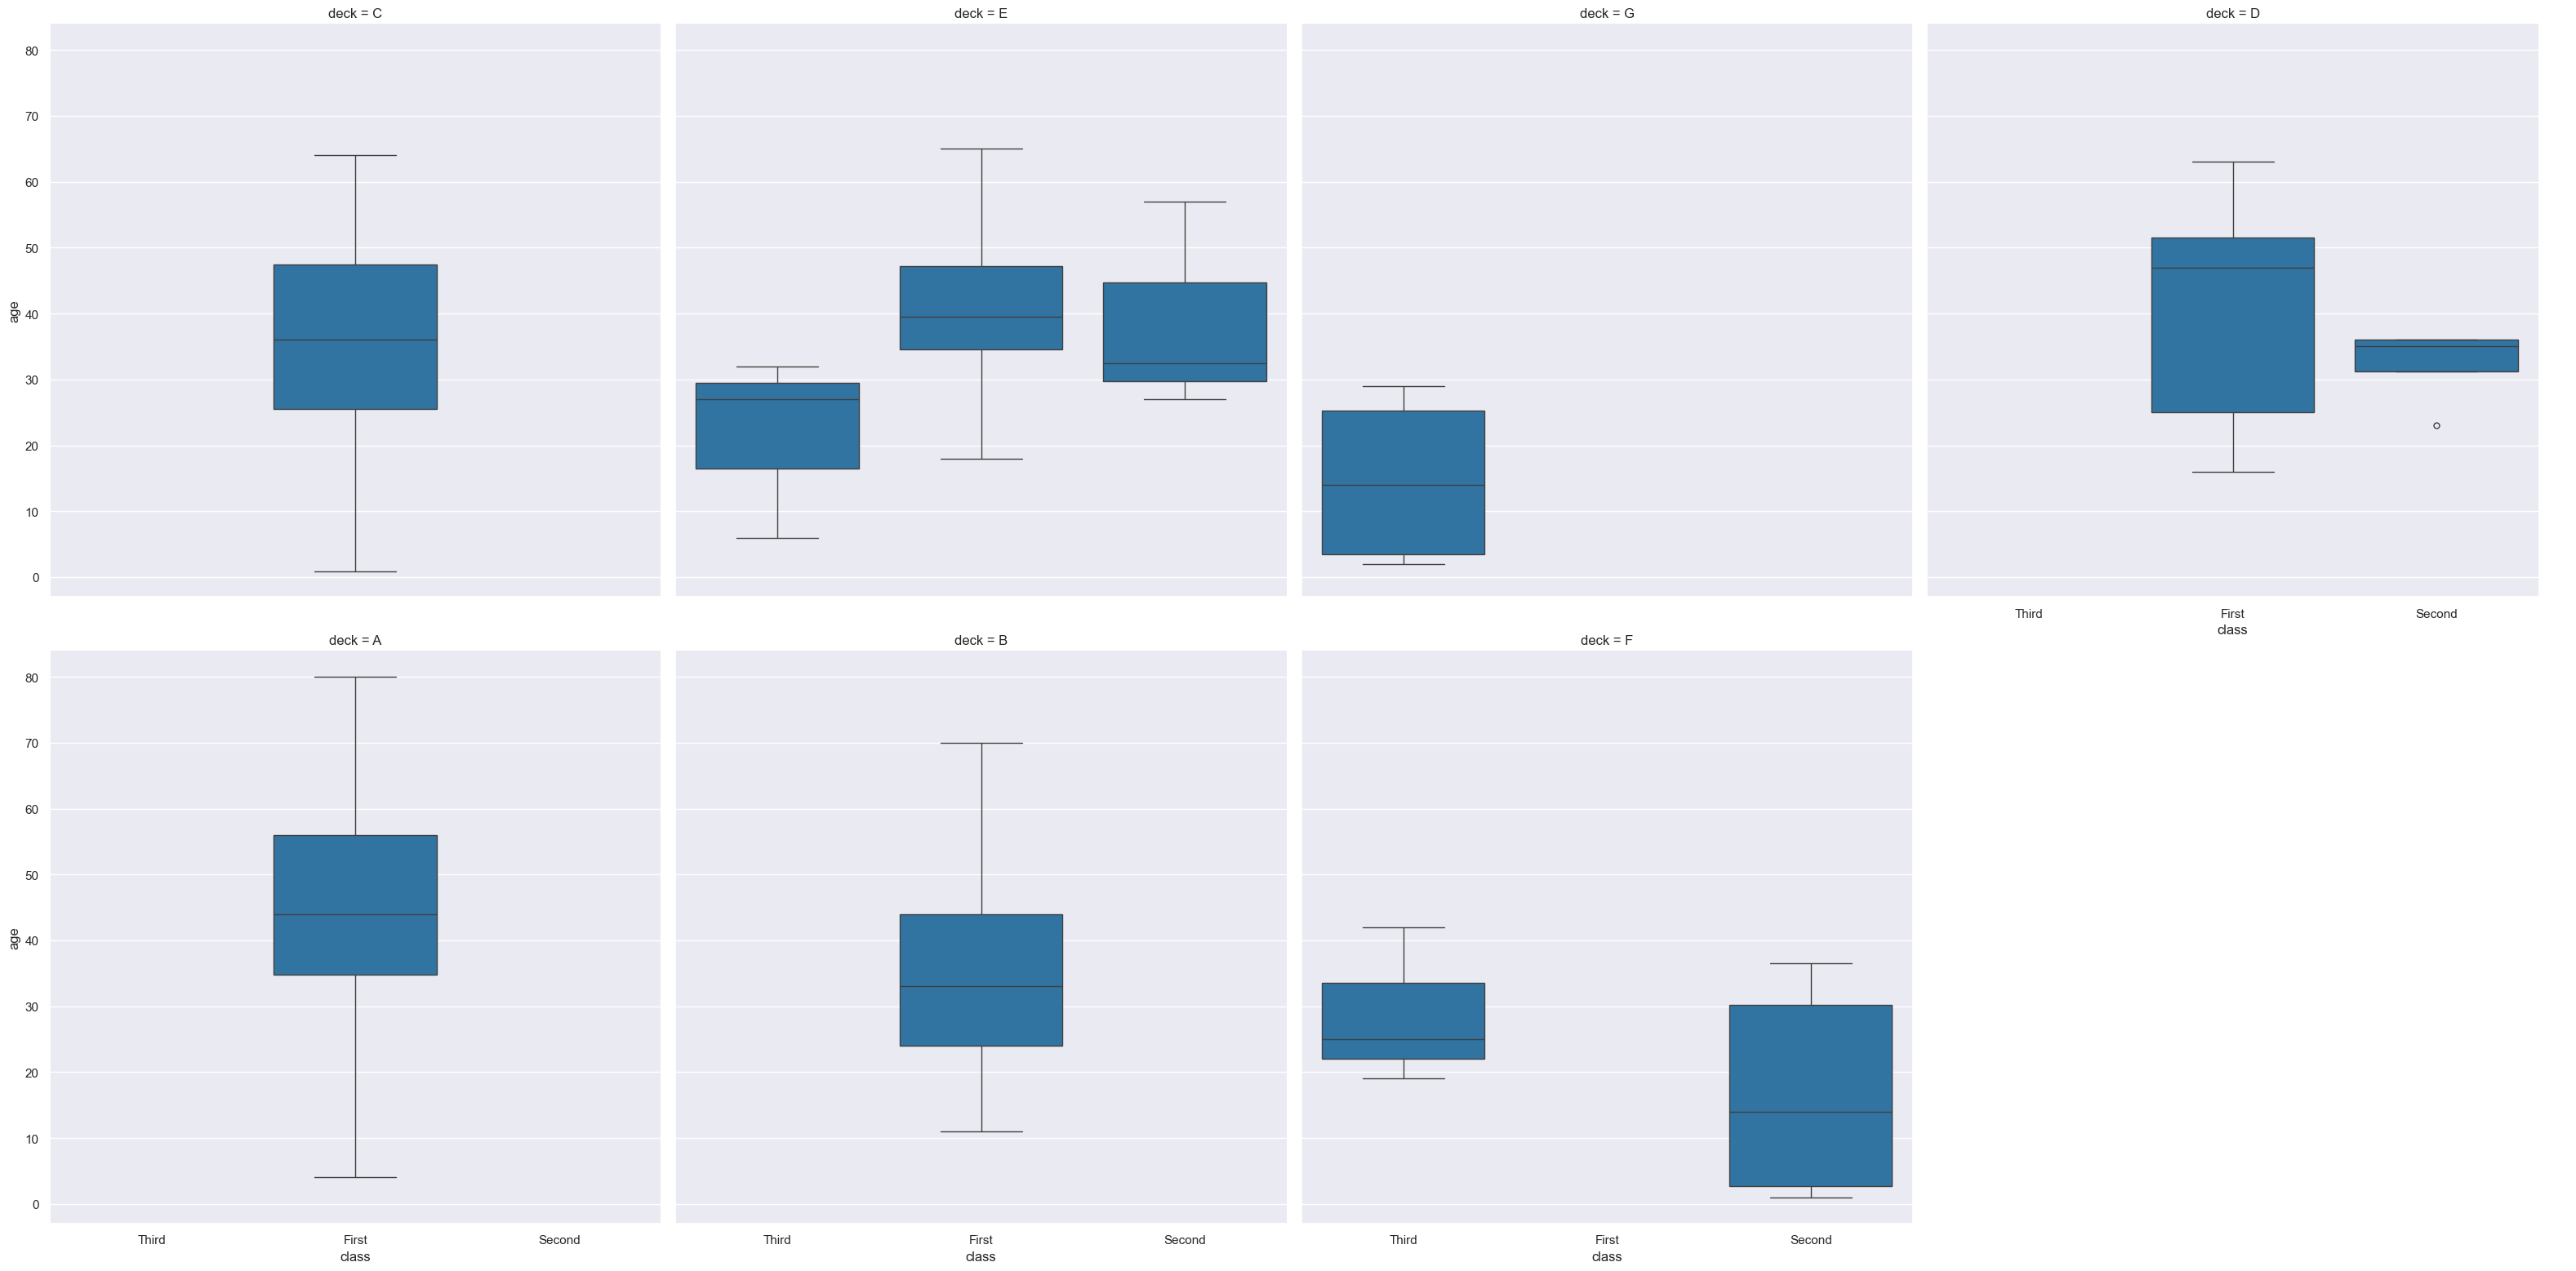
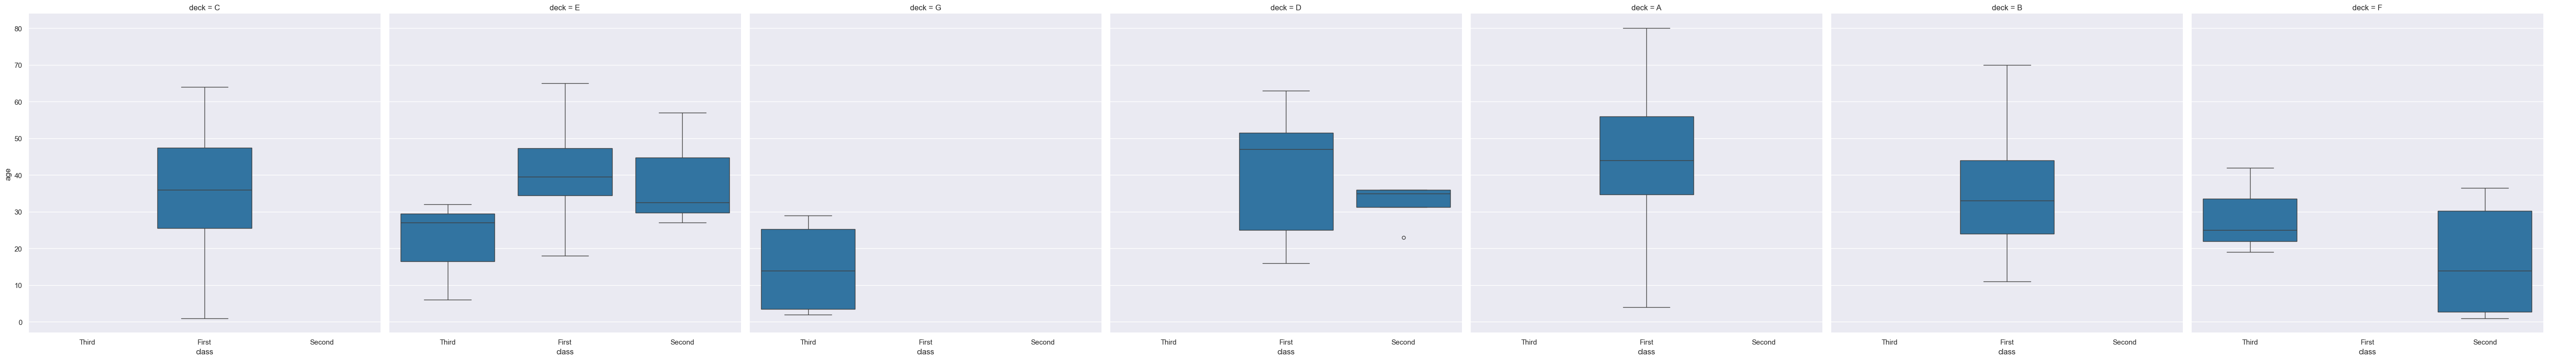
There were seven decks for passengers on the Titanic, labelled A to G. The following box plot uses facets to split into two sub-plots column-wise based on deck:
gurita box -y age -x class --fcol deck < titanic.csv
The width of the number of columns in a facet plot can be controlled using the --fcolwrap INT argument. This limits the maximum number of facet columns to INT in each row. When a facet row is longer than INT it will wrap around to the next row.
The following command shows the effect of --fcolwrap 4 on the previous command:
gurita box -y age -x class --fcol deck --fcolwrap 4 < titanic.csv