kmeans
The k-means clustering algorithm identifies clusters in numerical data where individual data points are assigned to the cluster with the nearest mean (cluster centroid).
The number of clusters to detect is specified as an optional parameter (default is 2).
The kmeans command adds a new column to the dataset storing the cluster label for the corresponding datapoint on each row.
Clustering does not work with missing values, so rows with missing (NA) values in the clustered columns are automatically removed before clustering.
Usage
gurita kmeans [-h] [-c COLUMN [COLUMN ...]] [--name NAME] [-n NCLUSTERS]
Arguments
Argument |
Description |
Reference |
|---|---|---|
|
display help for this command |
|
|
apply clustering to specified numerical columns |
|
|
identify this many clusters in the data |
|
|
choose a column name for the new cluster label column (default: cluster) |
See also
Gaussian Mixture Models provide another way to cluster data.
Simple example
The following command clusters the numerical columns in the iris.csv file:
gurita kmeans < iris.csv
The output is quite long so we can adjust the command to look at only the first few rows using the head command:
gurita kmeans + head < iris.csv
The output of the above command is as follows:
sepal_length,sepal_width,petal_length,petal_width,species,cluster
5.1,3.5,1.4,0.2,setosa,1
4.9,3.0,1.4,0.2,setosa,1
4.7,3.2,1.3,0.2,setosa,1
4.6,3.1,1.5,0.2,setosa,1
5.0,3.6,1.4,0.2,setosa,1
A new categorical column called cluster is added to the dataset, this holds the cluster labels for the datapoint on each row.
Each cluster is labelled using a natural number (0,1,2 …).
We can get an overview of the new cluster column by using the describe command after clustering:
gurita kmeans + describe -c cluster < iris.csv
The output of the above command is shown below:
        cluster
count       150
unique        2
top           0
freq         97
We can see that there are 150 data points (150 rows) and 2 unique values in the cluster column (these are the labels 0 and 1). The most frequent
label is 0 which occurs 97 times (and thus the label 1 must occur 150-97=53 times).
Note
Despite the use of numbers for cluster labels, Gurita treats them as categorical values.
This is beneficial when it comes to plotting data using cluster labels because it means that the plots will correctly interpret the labels as catergorical values and render them accordingly.
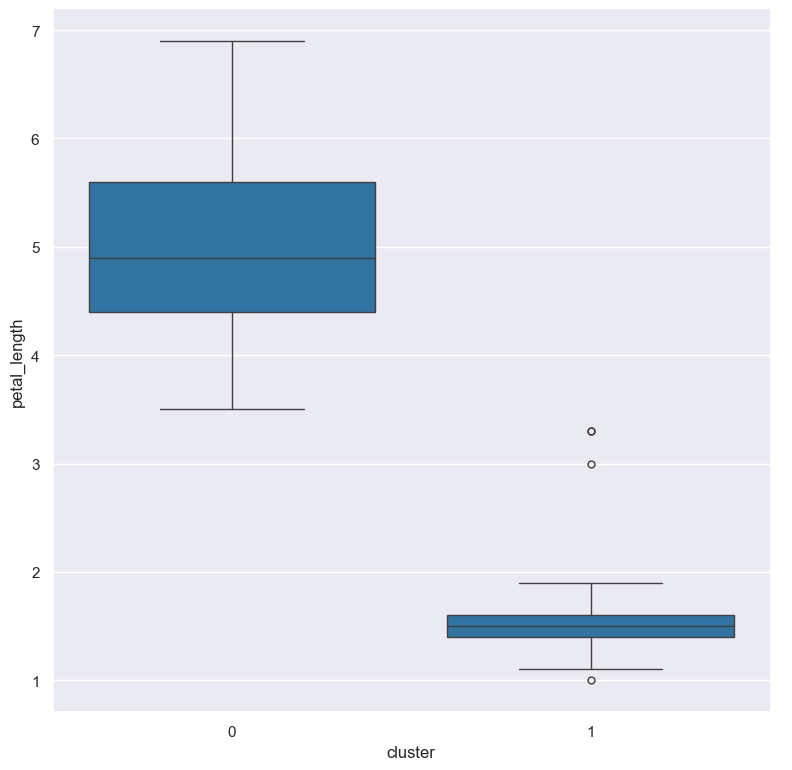
For example we might like to make a box plot comparing the petal_length across the two clusters:
gurita kmeans + box -x cluster -y petal_length < iris.csv
The output of the above command is written to box.cluster.petal_length.png:
Getting help
The full set of command line arguments for kmeans can be obtained with the -h or --help
arguments:
gurita kmeans -h
Cluster data from specified numerical columns
-c NAME [NAME ...], --col NAME [NAME ...]
By default, if no column names are specified, clustering is performed on all of the numerical columns in the dataset.
However it is possible to perform clustering on a specific subset of columns via the -c/--col argument.
For example, the following command performs k-means clustering on just the columns sepal_length, sepal_width, and petal_length (and hence ignores the petal_width column):
gurita kmeans -c sepal_length sepal_width petal_length < iris.csv
Note
Non-numeric columns will be ignored by kmeans even if they are specified as arguments to -c/--col.
Choose number of clusters to identify
-n NCLUSTERS, --nclusters NCLUSTERS
By default kmeans identifies two clusters in the data. However, this can be changed with the -n/--nclusters argument.
For example, the following command finds three clusters in the iris.csv file:
gurita kmeans -n 3 < iris.csv
We can check the number of values in each cluster using the grouby command:
gurita kmeans -n 3 + groupby -k cluster < iris.csv
The output of the above command is shown below:
cluster,size
0,62
1,50
2,38
We can observe three clusters labelled 0,1,2 with 39,61,50 members respectively.
Choose a name for the new cluster label column
--name NAME
The kmeans command adds an extra categorical column called cluster to the dataset to store the cluster labels for each row.
The cluster labels are natural numbers (non-negative integers) from 0 upwards (0, 1, 2, …).
The name of the extra column can be changed with the --name argument.
The following command specifies that grouping should be used as the prefix for the newly added columns:
gurita kmeans --name grouping < iris.csv
By chaining this command with head we can inspect the first few rows of the output:
gurita kmeans --name grouping + head < iris.csv
The output of the above command is as follows:
sepal_length,sepal_width,petal_length,petal_width,species,grouping
5.1,3.5,1.4,0.2,setosa,0
4.9,3.0,1.4,0.2,setosa,0
4.7,3.2,1.3,0.2,setosa,0
4.6,3.1,1.5,0.2,setosa,0
5.0,3.6,1.4,0.2,setosa,0
Observe that the new cluster label column is called grouping.