lmplot
A scatter plot with a fitted linear model (linear regression).
Usage
gurita lmplot [-h] [-x COLUMN] [-y COLUMN] ... other arguments ...
Arguments
Argument |
Description |
Reference |
|---|---|---|
|
display help |
|
|
select column for the X axis |
|
|
select column for the Y axis |
|
|
group columns by hue |
|
|
order of hue columns |
|
|
column to use for facet rows |
|
|
column to use for facet columns |
|
|
wrap the facet column at this width, to span multiple rows |
See also
Lmplots are based on Seaborn’s lmplot library function.
Simple example
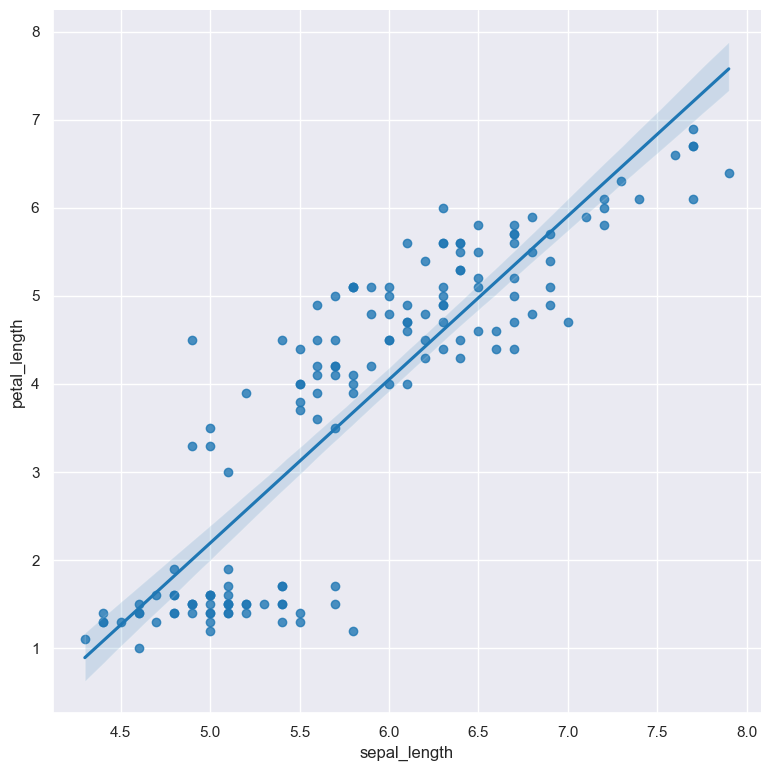
A lmplot showing the relationship between sepal_length and petal_length in the iris.csv data set:
gurita lmplot -x sepal_length -y petal_length < iris.csv
The output of the above command is written to lmplot.sepal_length.petal_length.png.
Getting help
The full set of command line arguments for lmplots can be obtained with the -h or --help
arguments:
gurita lmplot -h
Selecting columns to plot
-x COLUMN, --xaxis COLUMN
-y COLUMN, --yaxis COLUMN
The X and Y axes of an lmplot can be selected using -x (or --xaxis) and -y (or --yaxis).
Both axes in an lmplot must be numerical.
Grouping data points with hue
--hue COLUMN
The data points can be grouped by an additional numerical or categorical column with the --hue argument.
A linear model will be fitted to each separate group of points.
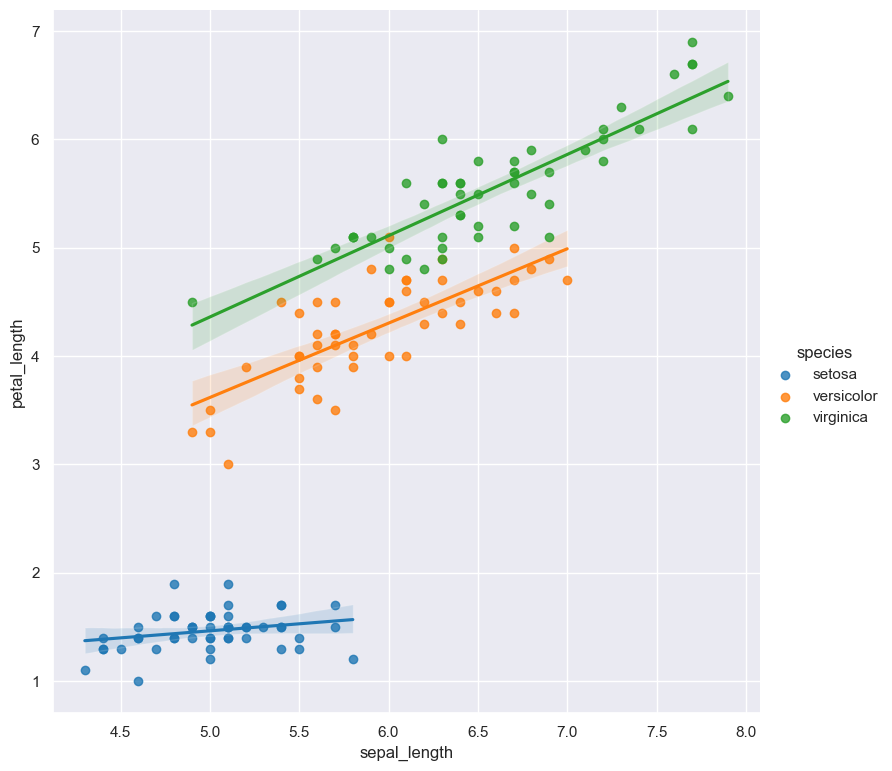
In the following example the data points in an lmplot comparing sepal_length and petal_length are
grouped by their corresponding categorical day value, and a linear model is fitted to both groups.
gurita lmplot -x sepal_length -y petal_length --hue species < iris.csv
For categorical hue groups, the order displayed in the legend is determined from their occurrence in the input data. This can be overridden with the --hueorder argument, which allows you to specify the exact ordering of
the hue groups in the legend.
Facets
--frow COLUMN
--fcol COLUMN
--fcolwrap INT
Lmplots can be further divided into facets, generating a matrix of plots, where a numerical value is further categorised by up to 2 more categorical columns.
See the facet documentation for more information on this feature.
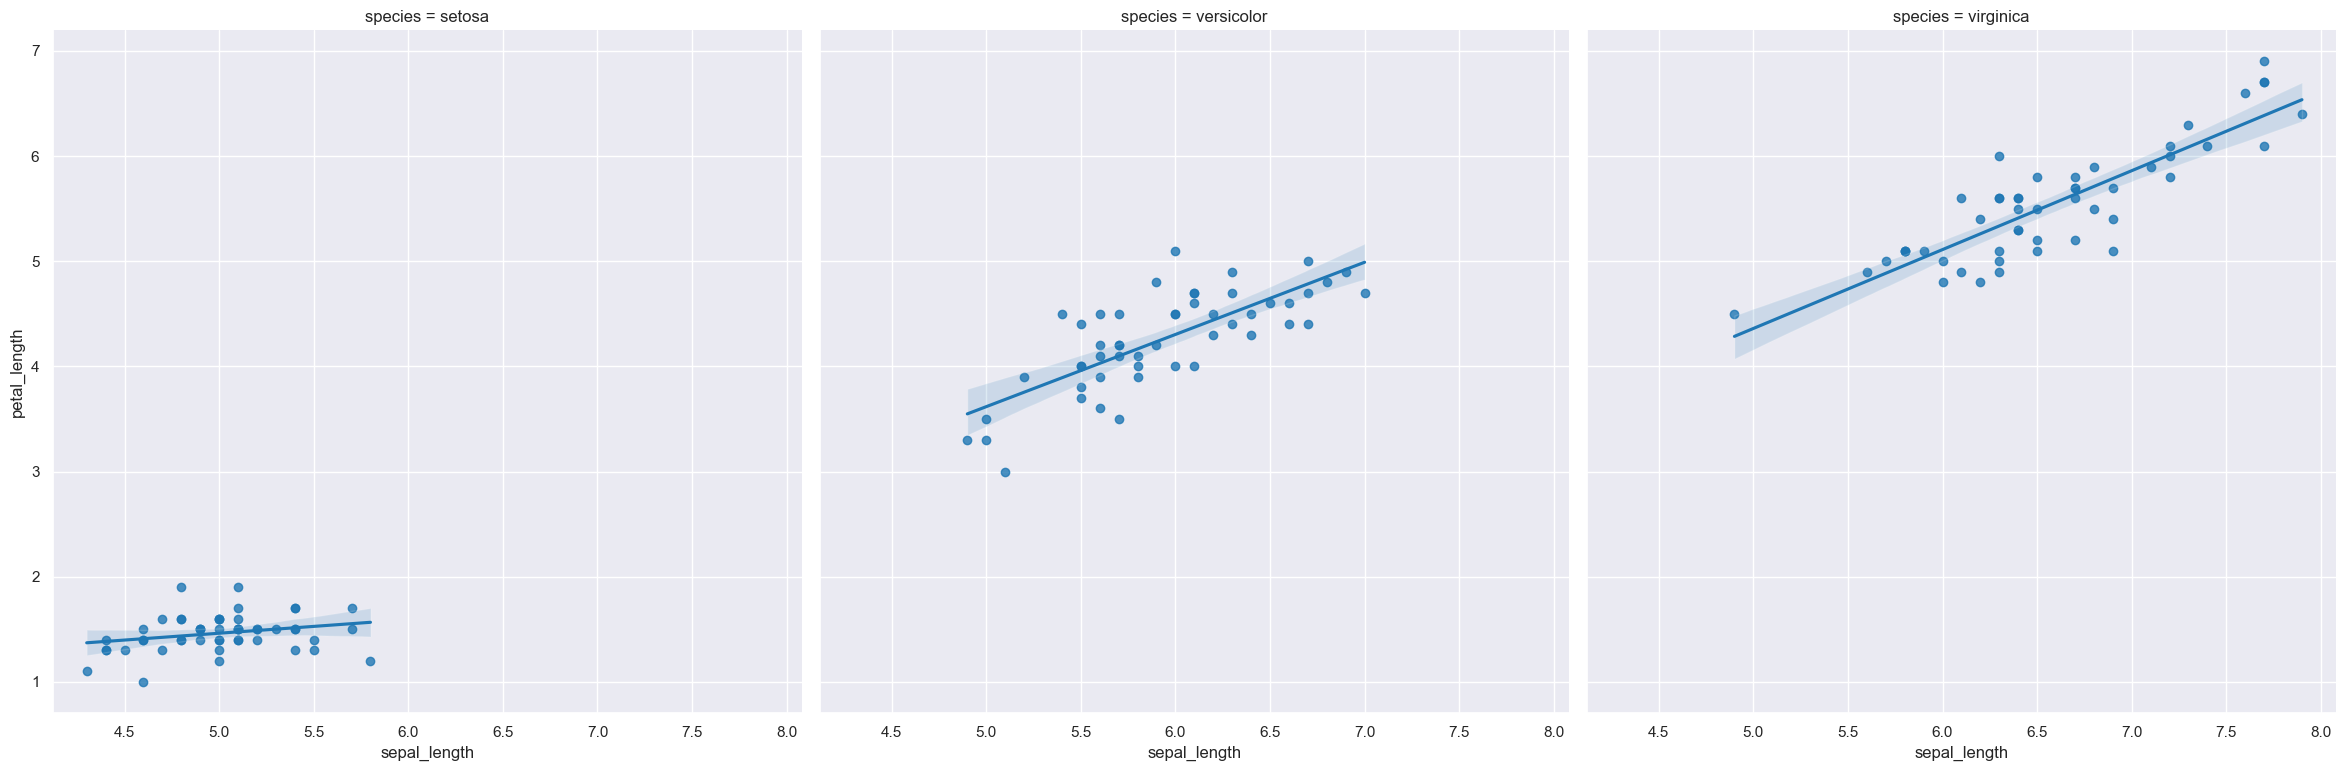
For example the following command produces an lmplot comparing sepal_length with petal_length, such that facet column is determined by the value of the species column.
gurita lmplot -x sepal_length -y petal_length --fcol species < iris.csv